
Example run of Energy community simulation
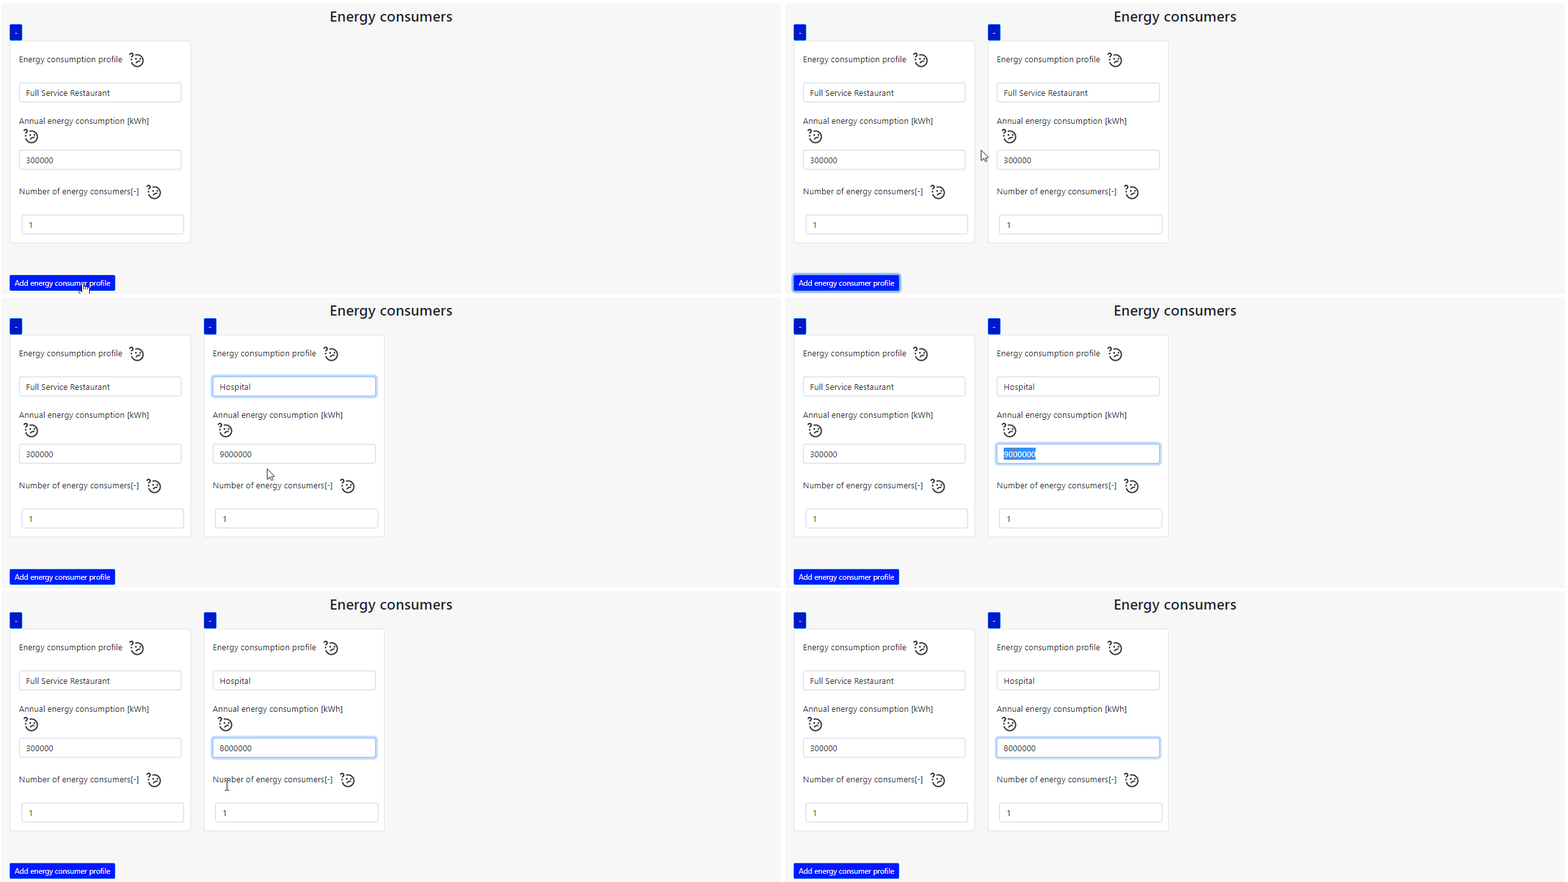
The user is expected to select a set of consumer(s) and a set of producer(s).
In case, one needs to represent a prosumer, represent a consumer system alongside a producer. Since a prosumer is just a combination of
a consumer and producer.
Regarding the Consumer section, there is an automatic proposal of annual consumption given everytime a change is done for a system 'Energy consumer profile' variable.
The user is invited to modify this automatic proposal. This proposal helps to have a magnitude of consumption for such type of systems.
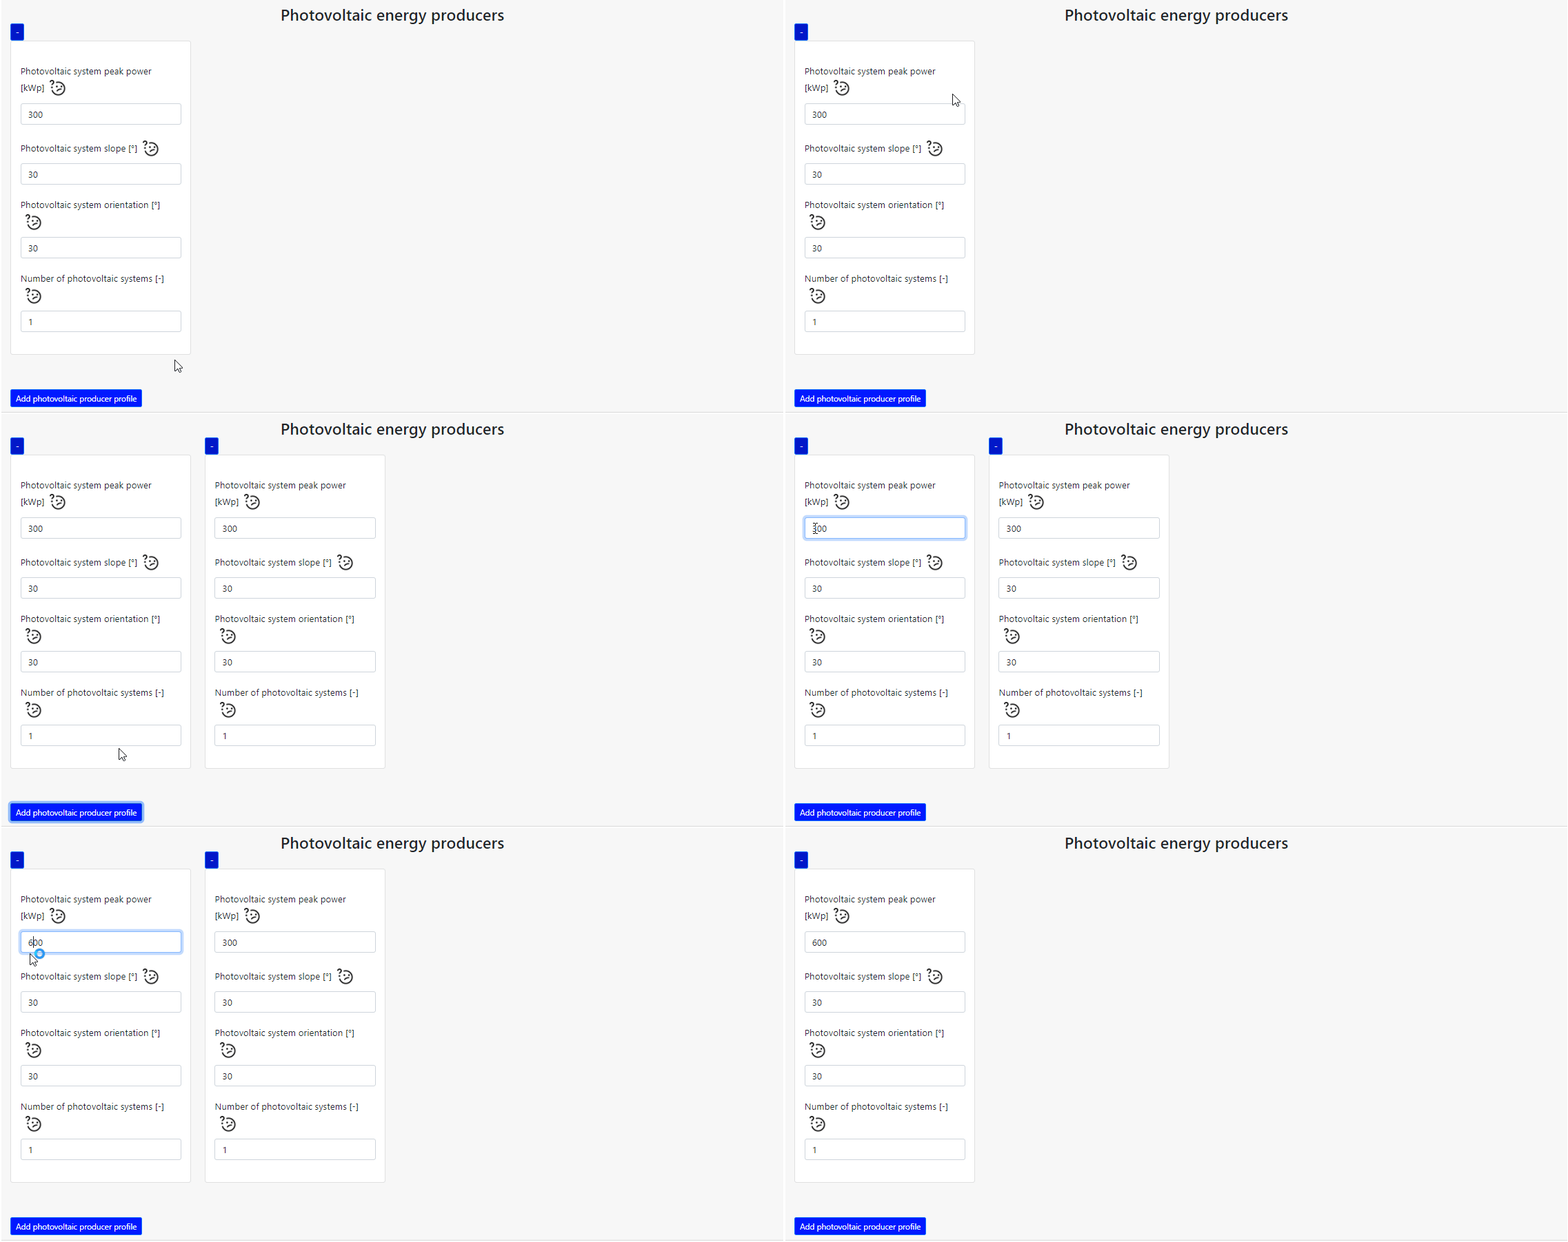
 Regarding the Producer section,consider adding a set of producer profiles (at least 1). Have in mind to size the scenario between your set of consumers vs producers.
We give free range to the user to put whatever sizing he feels adequate in order to test out different scenarios.
A live preview on the form estimates yearly PV vs demand from your capacities; after a run, results refine that with location weather and profiles.
Regarding the Producer section,consider adding a set of producer profiles (at least 1). Have in mind to size the scenario between your set of consumers vs producers.
We give free range to the user to put whatever sizing he feels adequate in order to test out different scenarios.
A live preview on the form estimates yearly PV vs demand from your capacities; after a run, results refine that with location weather and profiles.
 The whole analysis will be aggregated to the overall neighborhood level in order to assess the self consumption and self-sufficiency
ratio of the scenario entered as an energy community.
The Financials section uses the same assumptions as the prosumer tool (install cost, buy/export prices, discount rate, horizon) as an illustrative community proxy
, one tariff and flat €/kW on total capacity; open the help icon there for caveats.
For a bankable or regulatory-compliant business case, contact LuciSun via Support or info@lucisun.com.
The whole analysis will be aggregated to the overall neighborhood level in order to assess the self consumption and self-sufficiency
ratio of the scenario entered as an energy community.
The Financials section uses the same assumptions as the prosumer tool (install cost, buy/export prices, discount rate, horizon) as an illustrative community proxy
, one tariff and flat €/kW on total capacity; open the help icon there for caveats.
For a bankable or regulatory-compliant business case, contact LuciSun via Support or info@lucisun.com.
You will need to run a simulation by clicking on 'Check simulation results' in order to have a dashboard where you can visualize your simulation results.